


Introduction
In this data-driven world today, businesses work on the basis of analysis to make decisions, gain efficiency, and create a competitive advantage. However, the successful delivery of a data analysis project is more than just numbers. It is all about understanding client needs, managing expectations, and coming up with solutions that are both insightful and practical.
Being an end-to-end data analysis project worker has developed for me a well-structured process, both in technical skills and the management of projects. I’ll take you through all stages of the data analysis project lifecycle-from requirement gathering to final delivery, as well as insights and practical tips based on real-world experience. You will find actionable steps here that you can use in dealing with your own projects-from project managers, data analysts, to decision-makers.
The lifecycle of a data analysis project
Data analysis projects are not done overnight, but rather in a series of well-coordinated, deliberate steps. Let’s break the lifecycle into data analysis project stages.
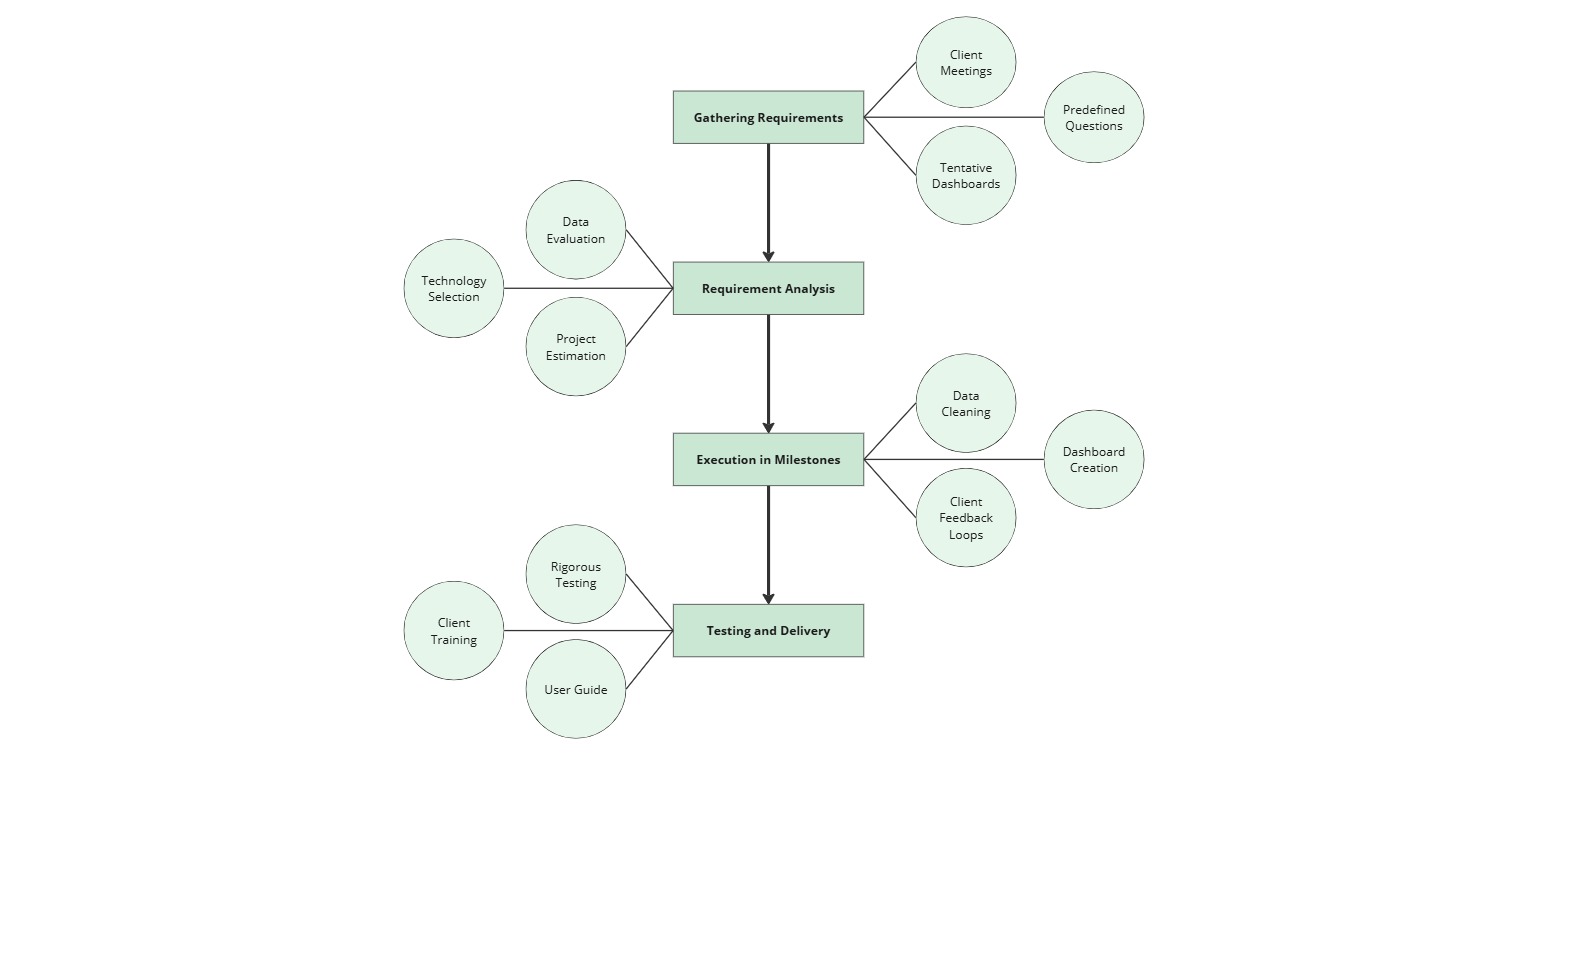
Steps in data analysis project:
Step 1: Gathering requirements and initial discussions
Every project begins with a discussion. The client usually meets us with a sample data set and a general idea of what they want. This can be anything ranging from tracking KPIs, visualizing trends, to automating workflows. For all of them, first comes the proper understanding of their needs.
At this stage, our primary focus is on listening and clarifying. While the client may have a vision, it’s often high-level and lacks the technical details needed to execute it. To bridge this gap, we rely on a set of predefined questions tailored to data analysis projects. These questions help us uncover the project’s full scope.
For example:
-
What specific insights are you looking for?
-
What KPIs are critical to your business?
-
What format do you want the outputs in (e.g., dashboards, reports)?
How often will the data be updated
Temporary dashboards come into play here. Creating a draft based on the initial data and requirements will help the client visualize his ideas, thus making it easier for him to refine his needs and ensuring that we are in line before we move ahead.
Pro tip: Never underestimate the power of a collaborative discussion. Ask clients to share their pain points and goals openly. Sometimes, the real problem lies beneath the surface, and it’s your job to uncover it.
Step 2: Requirement analysis
Once we’ve gathered the initial client requirements for data projects, it’s time to dig deeper. This phase involves analyzing the dataset and defining the project’s roadmap.
Dataset evaluation
The first step is to evaluate the data itself. Ask questions like:
-
Does the data align with the project’s objectives?
-
Are there missing values, duplicates, or inconsistencies?
-
Is the data arranged in a way that facilitates the needed analysis?
For instance, if the client’s goal is to track monthly sales trends, but the data is only available quarterly, we’ll need to address that gap first.
Technology selection
Next, we determine the data analysis tools and technologies required. For example:
-
Power BI for data analysis: To create interactive dashboards.
-
Python: For preprocessing, data wrangling, and custom scripts.
-
Postgres: To store and manage large datasets.
-
Docker: For ensuring consistency across development and deployment.
Choosing the right tools is about balancing the client’s requirements with your team’s expertise.
Estimation
Finally, we estimate the time and effort required for the project. This involves:
-
Breaking down the project into smaller tasks.
-
Assigning realistic deadlines to each task.
-
Communicating the timeline clearly to the client.
Pro tip: Transparency at this stage builds trust. If there are uncertainties or dependencies, share them with the client so they’re aware of potential risks.
Step 3: Execution in milestones
Here’s where the actual work begins. Execution is the heart of any project, and breaking it into milestones makes it manageable and flexible.
The power of milestones
Milestones are mini-goals within the project timeline. For example:
-
Milestone 1: Data cleaning and preprocessing.
-
Milestone 2: Drafting the initial dashboard layout.
-
Milestone 3: Adding advanced features like filters, interactivity, or automation.
Every milestone ends with a demonstration for the client. In this method, there are two major benefits:
-
Early feedback: Sharing it step by step, we will ensure that the project gets aligned with the client’s vision.
-
Error correction: If it’s not working right, we can fix it immediately, rather than looking at it again after the project is completed.
Iterative development
Data analysis projects often require iteration. As clients see the progress, they may discover new needs or change their priorities. By working in milestones, we can adapt to these changes without disrupting the overall timeline.
Pro tip: Document every client feedback during milestone reviews. This creates a clear trail of decisions and ensures that both parties are aligned.
Step 4: Testing and delivery in data analysis
The final stages are about ensuring quality and delivering a product that meets (or exceeds) expectations.
Testing
Before handing over the project, we rigorously test every aspect:
-
Is the data correctly integrated into the dashboard?
-
Are all filters and interactions functioning as intended?
-
Does the automation process work seamlessly when new data is uploaded?
Client training
Delivery doesn’t end with handing over the dashboard. We also provide a detailed walkthrough to the client, covering:
-
How to use the dashboard.
-
How automation works and what to expect when data is updated.
-
What to do in case of errors or issues.
Pro tip: Create a short user guide or documentation to help the client navigate the dashboard post-delivery. This adds value and reduces dependency on your team for minor issues.
Are there any common challenges in the data analysis project lifecycle?
Challenge 1: Navigating new technology
Each project brings unique requirements. For example, automating certain aspects of a Power BI dashboard can be tricky if you’re not an expert.
Our solution:
-
Break down the problem into smaller components.
-
Use public forums, documentation, and community resources to find similar scenarios.
-
Experiment and build on others’ ideas to create a solution tailored to the project’s needs.
Challenge 2: Managing client expectations in data projects
Clients often discover new requirements once they see the project taking shape.
Our solution:
-
Deliver projects in milestones, ensuring regular feedback loops.
-
Be transparent about the impact of changes on the timeline and cost.
-
Encourage clients to articulate their vision clearly during each review.
Tools and techniques that make it happen
Here’s a closer look at the tools and techniques we rely on for efficiency and scalability:
-
Docker: Ensures consistency across development and deployment environments.
-
Python: Handles data preprocessing, exploratory data analysis (EDA), and complex transformations.
-
Postgres: Stores and manages large, structured datasets.
-
Power BI: Creates dynamic, interactive dashboards for data visualization and insights tailored to client needs.
-
VSCode & codium: Provides a powerful coding environment with AI-assisted suggestions to boost productivity.
By using the right tools at the right stage, we streamline the workflow and minimize errors.
Lessons learned: What experience taught us
After managing several end-to-end projects, I’ve gathered key lessons that shape my approach and which can work as best practices for data analysis projects:
-
Clarity is key: Miscommunication at the start can derail the entire project. Take the time to clarify every requirement and expectation.
-
Transparency builds trust: Be upfront about challenges, risks, and progress. This fosters better relationships with clients and teammates.
-
Adaptability is a strength: Projects does not always go exactly as planned. Embrace changes and use them as opportunities to improve the final outcome.
Conclusion: Your roadmap to success
Managing data analysis projects from beginning to end is very challenging, but at the same time, very rewarding. It’s about clear communication, step-by-step development, and applying the right tools for data analysis to produce solutions beyond what people anticipate.
To an expert and a novice alike, this guide should give something of a fresh perspective regarding how to manage projects effectively within the realm of data analysis. Remember: A good project is always learning experience, and the greater adaptability and transparency displayed in working on a project directly means success.

