


Introduction: Why reporting needs a smarter brain
Every Monday morning, project managers everywhere brace themselves for the same ritual: extracting hours, reconciling estimates, and deciphering task names like “final logic fix (urgent)”. If you’ve worked with Zoho Projects, you know the data’s all there—but translating that raw firehose of task logs into reliable, business-friendly reports? That’s another story.
At August Infotech, we asked a simple question: What if our reports didn’t just reflect data, but understood it?
This blog shares how we built a multi-layered, intelligent reporting system using machine learning, semantic search, and human insight to tackle the messiest part of project reporting—free-form task data. The result? Real-time dashboards that let our teams focus on productivity, not parsing.
We wanted our Project Management team to stop chasing spreadsheets and start getting insights, fast. So we built an internal system to automate two powerful reports from Zoho Projects data:
- Project hours report – a cumulative view of each project showing estimated vs. planned vs. actual hours, including billable vs. non-billable splits and productivity indicators.
- Weekly hours report – a week-by-week breakdown of each associate’s hours across custom-defined measurable categories.
This system helps the team track ROI, monitor project health, and surface productivity trends — all in a few clicks. But building it was far from plug-and-play.
If you’ve struggled with inconsistent task naming, manual spreadsheet gymnastics, or unclear project ROI, this behind-the-scenes breakdown is for you.
Task naming: The real villain
Zoho Projects gives us rich timesheet data — hours logged per task, per user, per project. Great in theory. But when it comes to actually categorizing tasks (e.g., Bug Fixing vs. Code Review), things break down quickly.
Our teams naturally name tasks based on what’s top-of-mind in the moment — not based on a pre-set category list. This inconsistency meant:
- Automated rules couldn’t map tasks reliably.
- Reports needed constant manual clean-up.
- And the classification logic didn’t scale.
So we took the hint: Let machines (and humans) help.
Our ML journey: From 17% to something smarter
We started with a baseline ML model. It scored just 17% accuracy when tested on real, messy data. That was humbling.
But instead of giving up, we got creative:
- We restructured our data using a curated set of categories with definitions and example tasks.
- We used both task titles and descriptions for richer context.
- We trained the model in multiple iterations — each time improving accuracy: 17% → 32% → 52% → 55%.
Distribution of labeled training data across categories — heavily skewed towards Backend Development tasks.
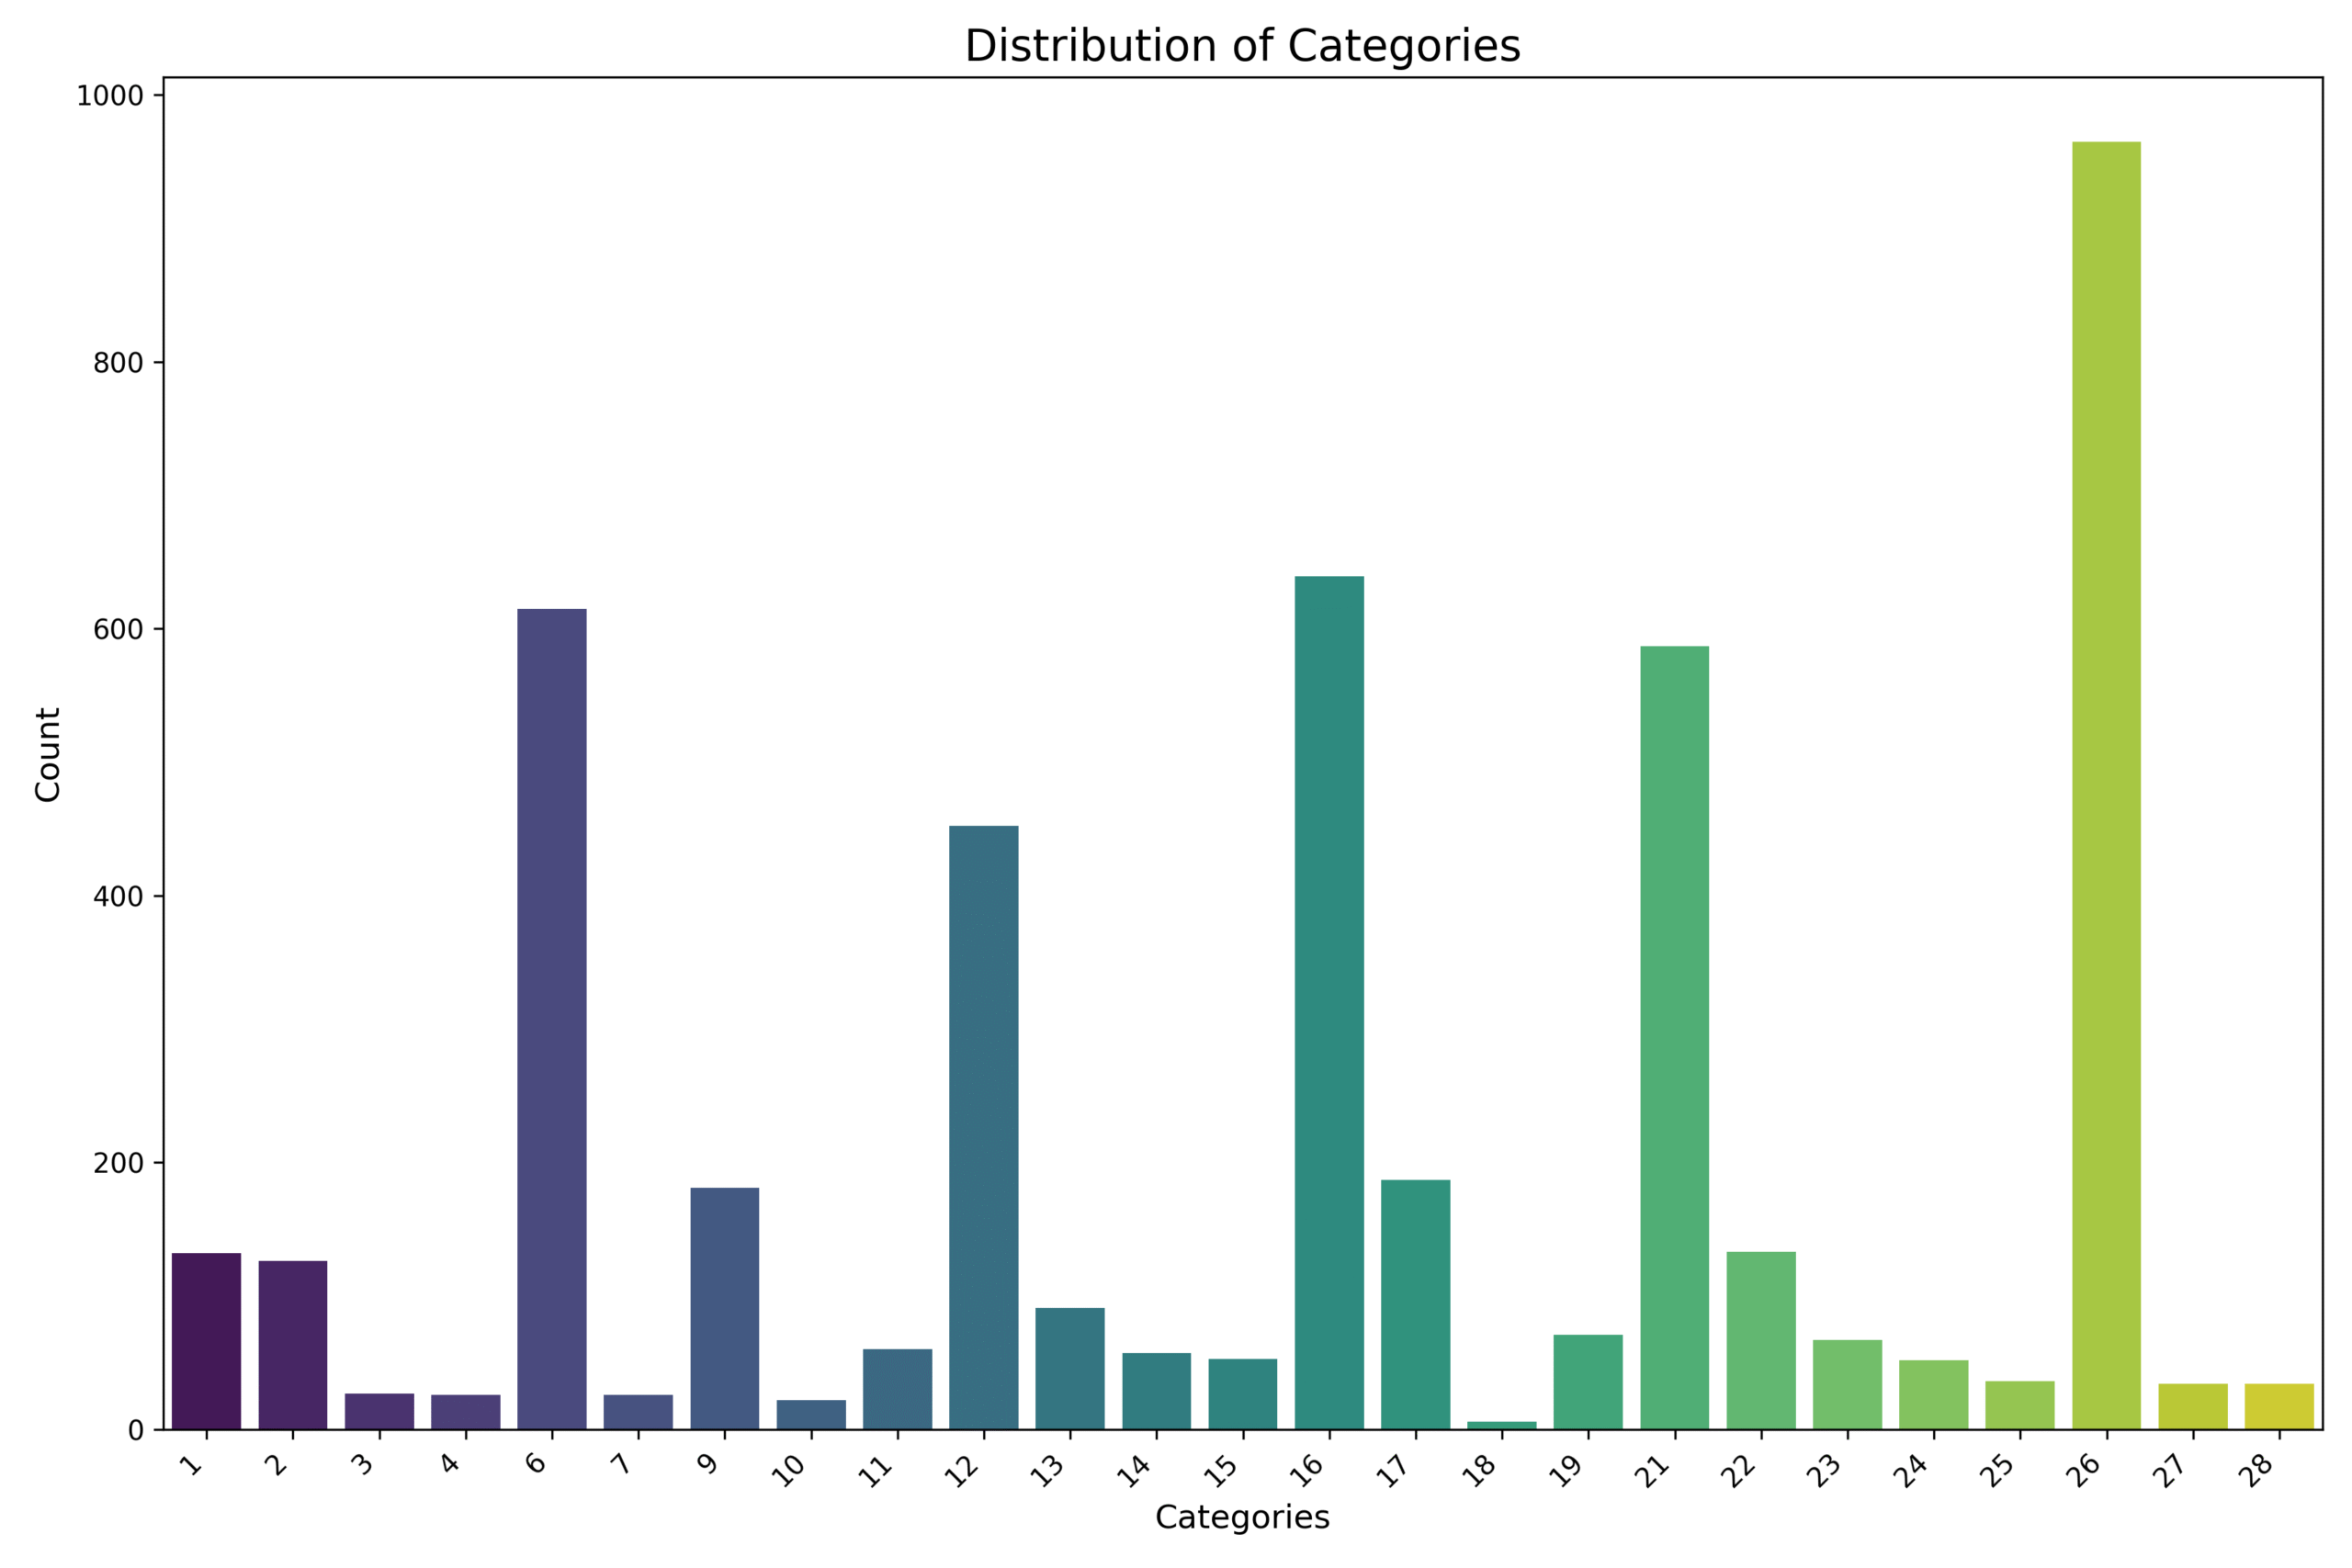
We trained on 4,679 historical task entries across 28 curated categories. But, like most real-world data, the distribution was far from balanced. The “Backend Development” category alone had over 900 samples, while several other categories had fewer than 50, with the smallest having just 6.
This skew made it hard for the model to learn generalizable patterns, especially for rare classes. That’s why we introduced a multi-stage fallback strategy — to ensure underrepresented tasks still had a shot at being accurately classified, even if the main model wasn’t confident.
A Smarter Hybrid: Multi-Stage Classification
Our final approach looks like this:
- Initial prediction: A general ML model trained on all categories predicts the task category.
- Confidence threshold check: If confidence is low, we fall back to a second model trained only on well-represented categories.
- Semantic search layer: Still fuzzy? We use all-MiniLM-L6-v2 from Hugging Face to semantically match the task to the best category based on meaning and context.
To visualize this approach, here’s how the full classification flow works behind the scenes:
Figure: Multi-stage task classification flow
A task passes through multiple fallback stages — from the primary ML model to high-confidence-only fallback, and finally, semantic similarity — before being either classified or sent for manual review.
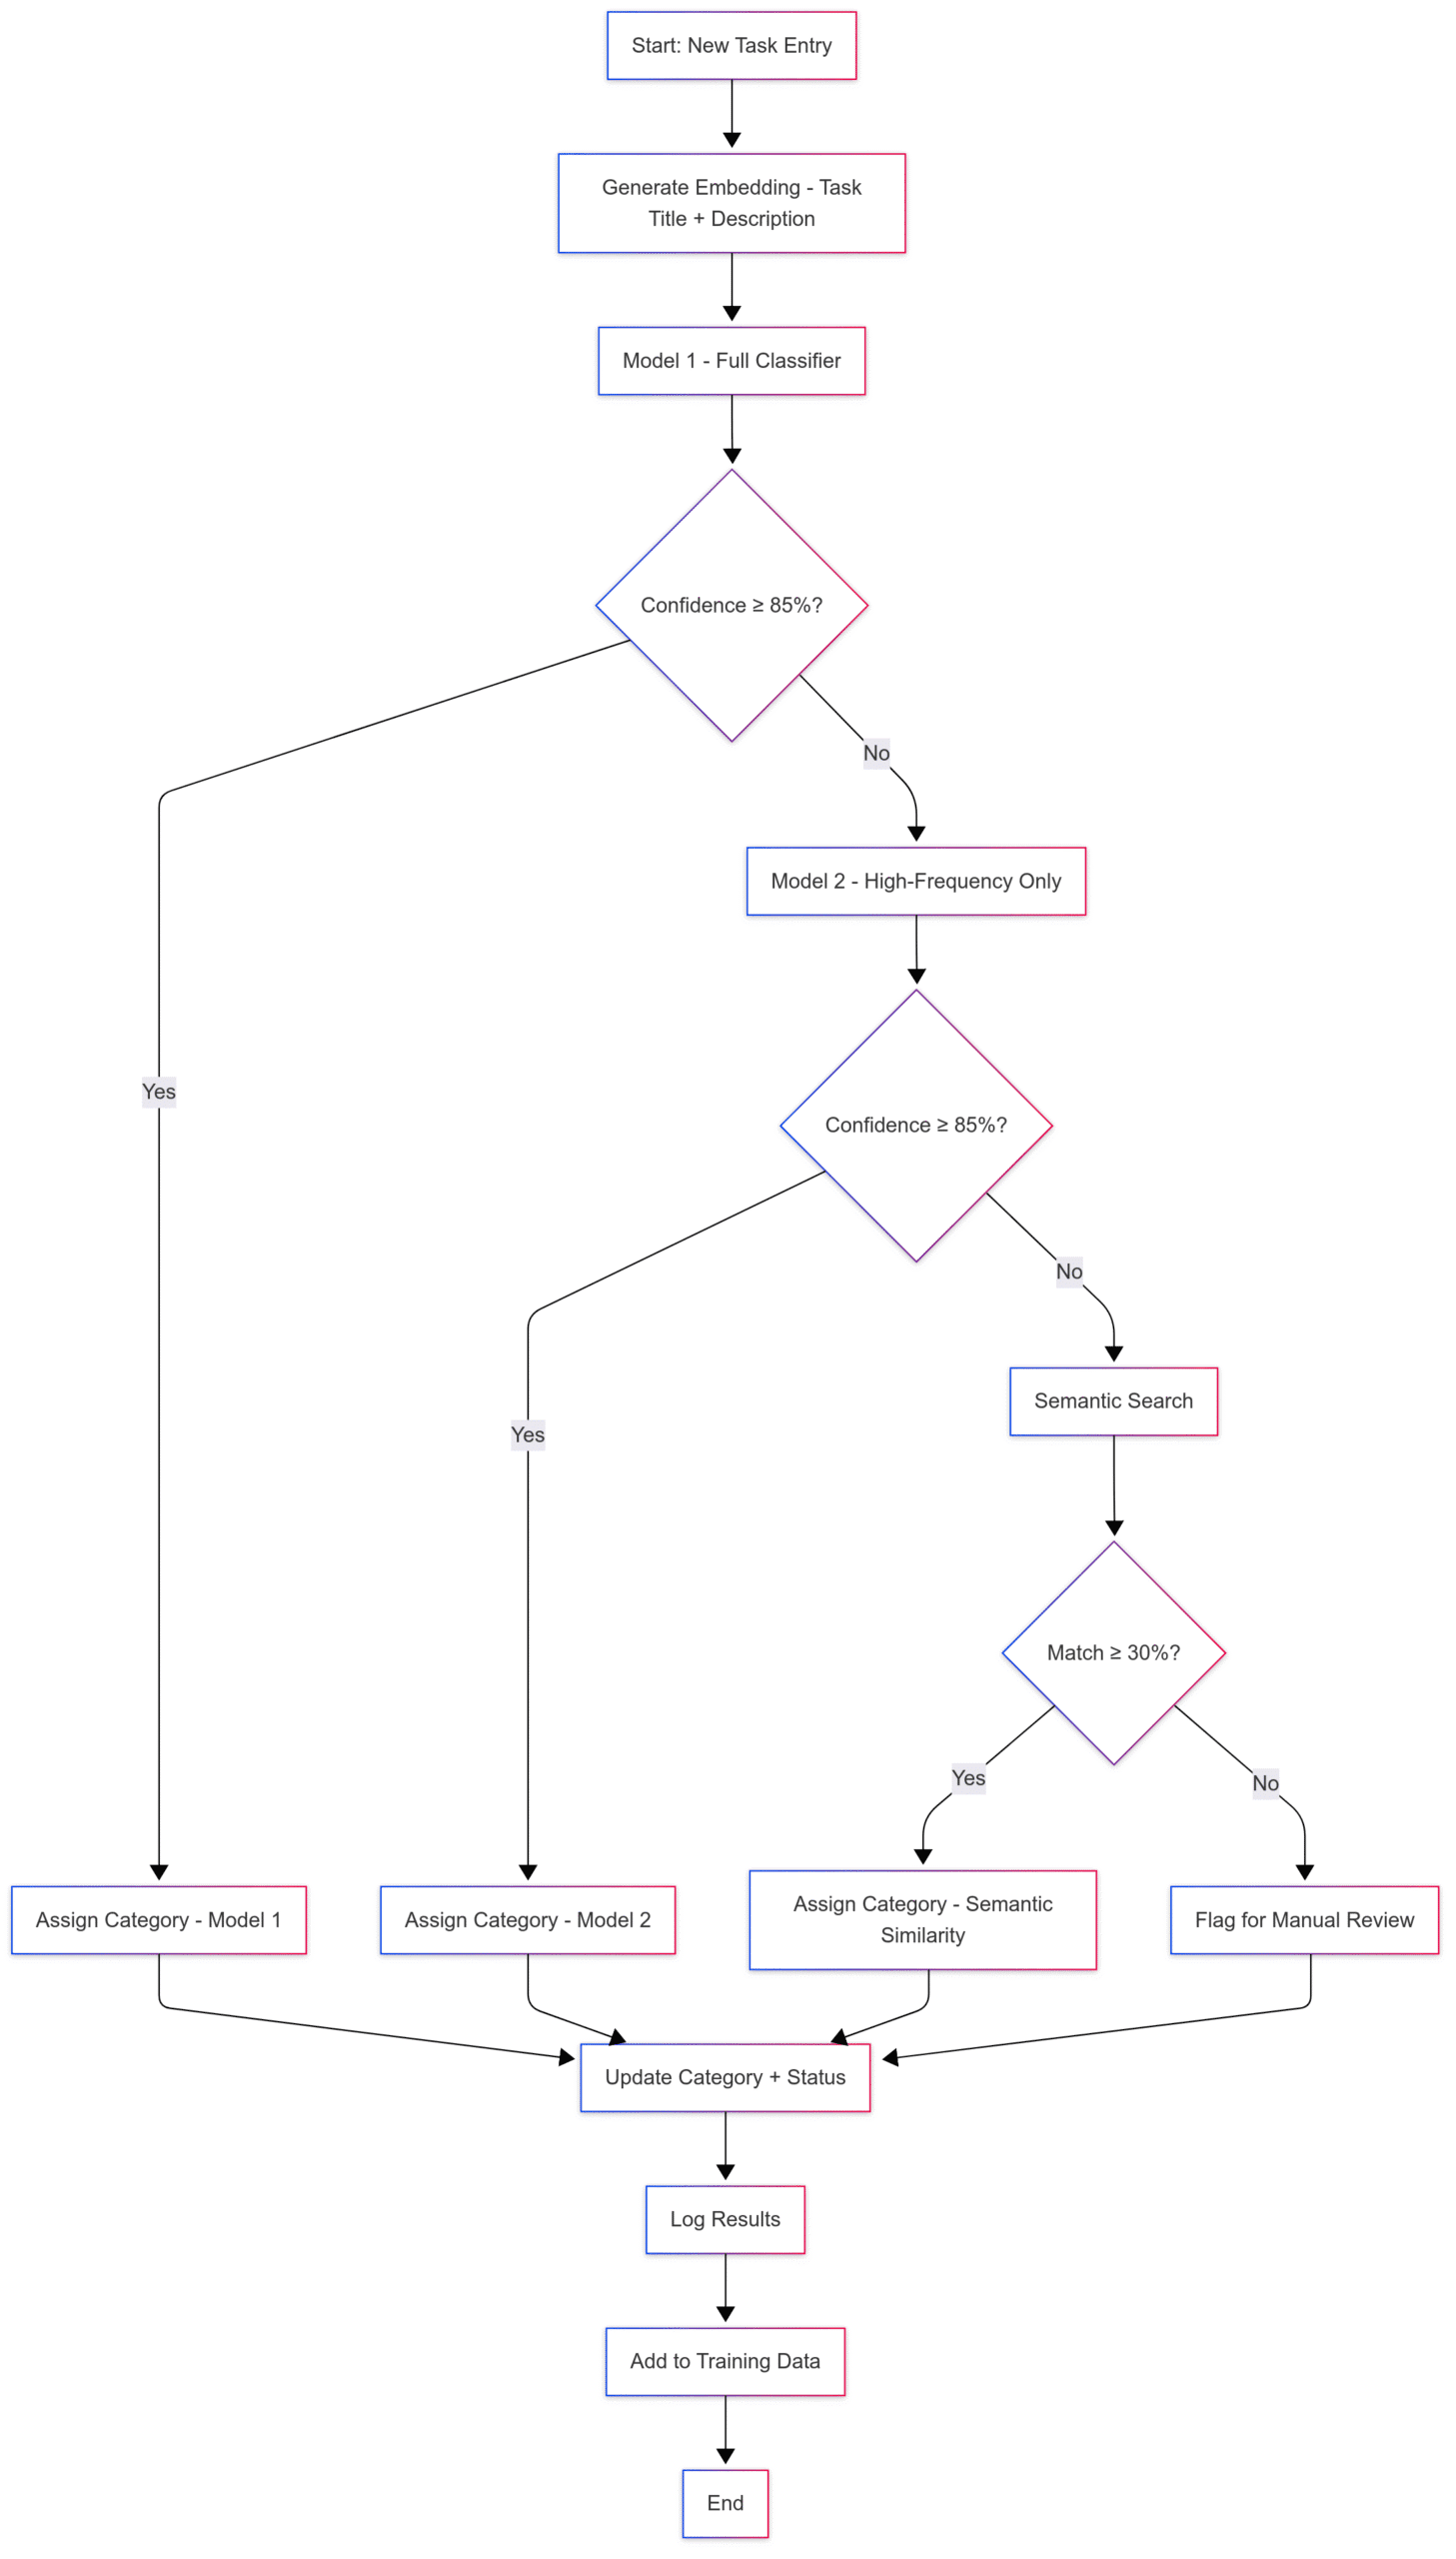
It’s not just brute force — it’s a thoughtful blend of classification and understanding.
Bringing meaning to categories with embeddings
To strengthen the semantic layer, we went a step further.
Our categories weren’t just labels — we gave them natural language descriptions that clarified what each one actually meant.
For example:
- “Bug fixing” → “Tasks involving identifying, reproducing, and fixing defects or issues in the system.”
- “Feature development” → “Building or enhancing product features based on specifications or user needs.”
We used these descriptions to generate semantic embeddings using all-MiniLM-L6-v2, enabling us to match tasks to categories based on meaning, not just keywords.
Here’s a simplified snippet of how this worked:
from sentence_transformers import SentenceTransformer, util


model = SentenceTransformer("all-MiniLM-L6-v2")


categories = [
    ("Bug Fixing", "Tasks involving identifying and fixing bugs in existing systems."),
    ("Feature Development", "Enhancing product features based on user needs.")
]
texts = [f"{name}: {desc}" for name, desc in categories]
category_embeddings = model.encode(texts, convert_to_tensor=True)


task = "Fix crash in login for admin users"
task_embedding = model.encode(task, convert_to_tensor=True)


hits = util.semantic_search(task_embedding, category_embeddings, top_k=1)
best_match = hits[0][0]
print(f"Predicted Category: {categories[best_match['corpus_id']][0]}")
Human-in-the-loop: Because context matters
We deployed the system to production with a human validation loop baked in:
- Tasks flagged as low-confidence are manually reviewed.
- This curated data feeds back into our training set for future retraining.
This approach balances speed with accuracy, and future-proofs us against data drift as teams evolve, new GenAI-based workflows emerge, or task styles change.
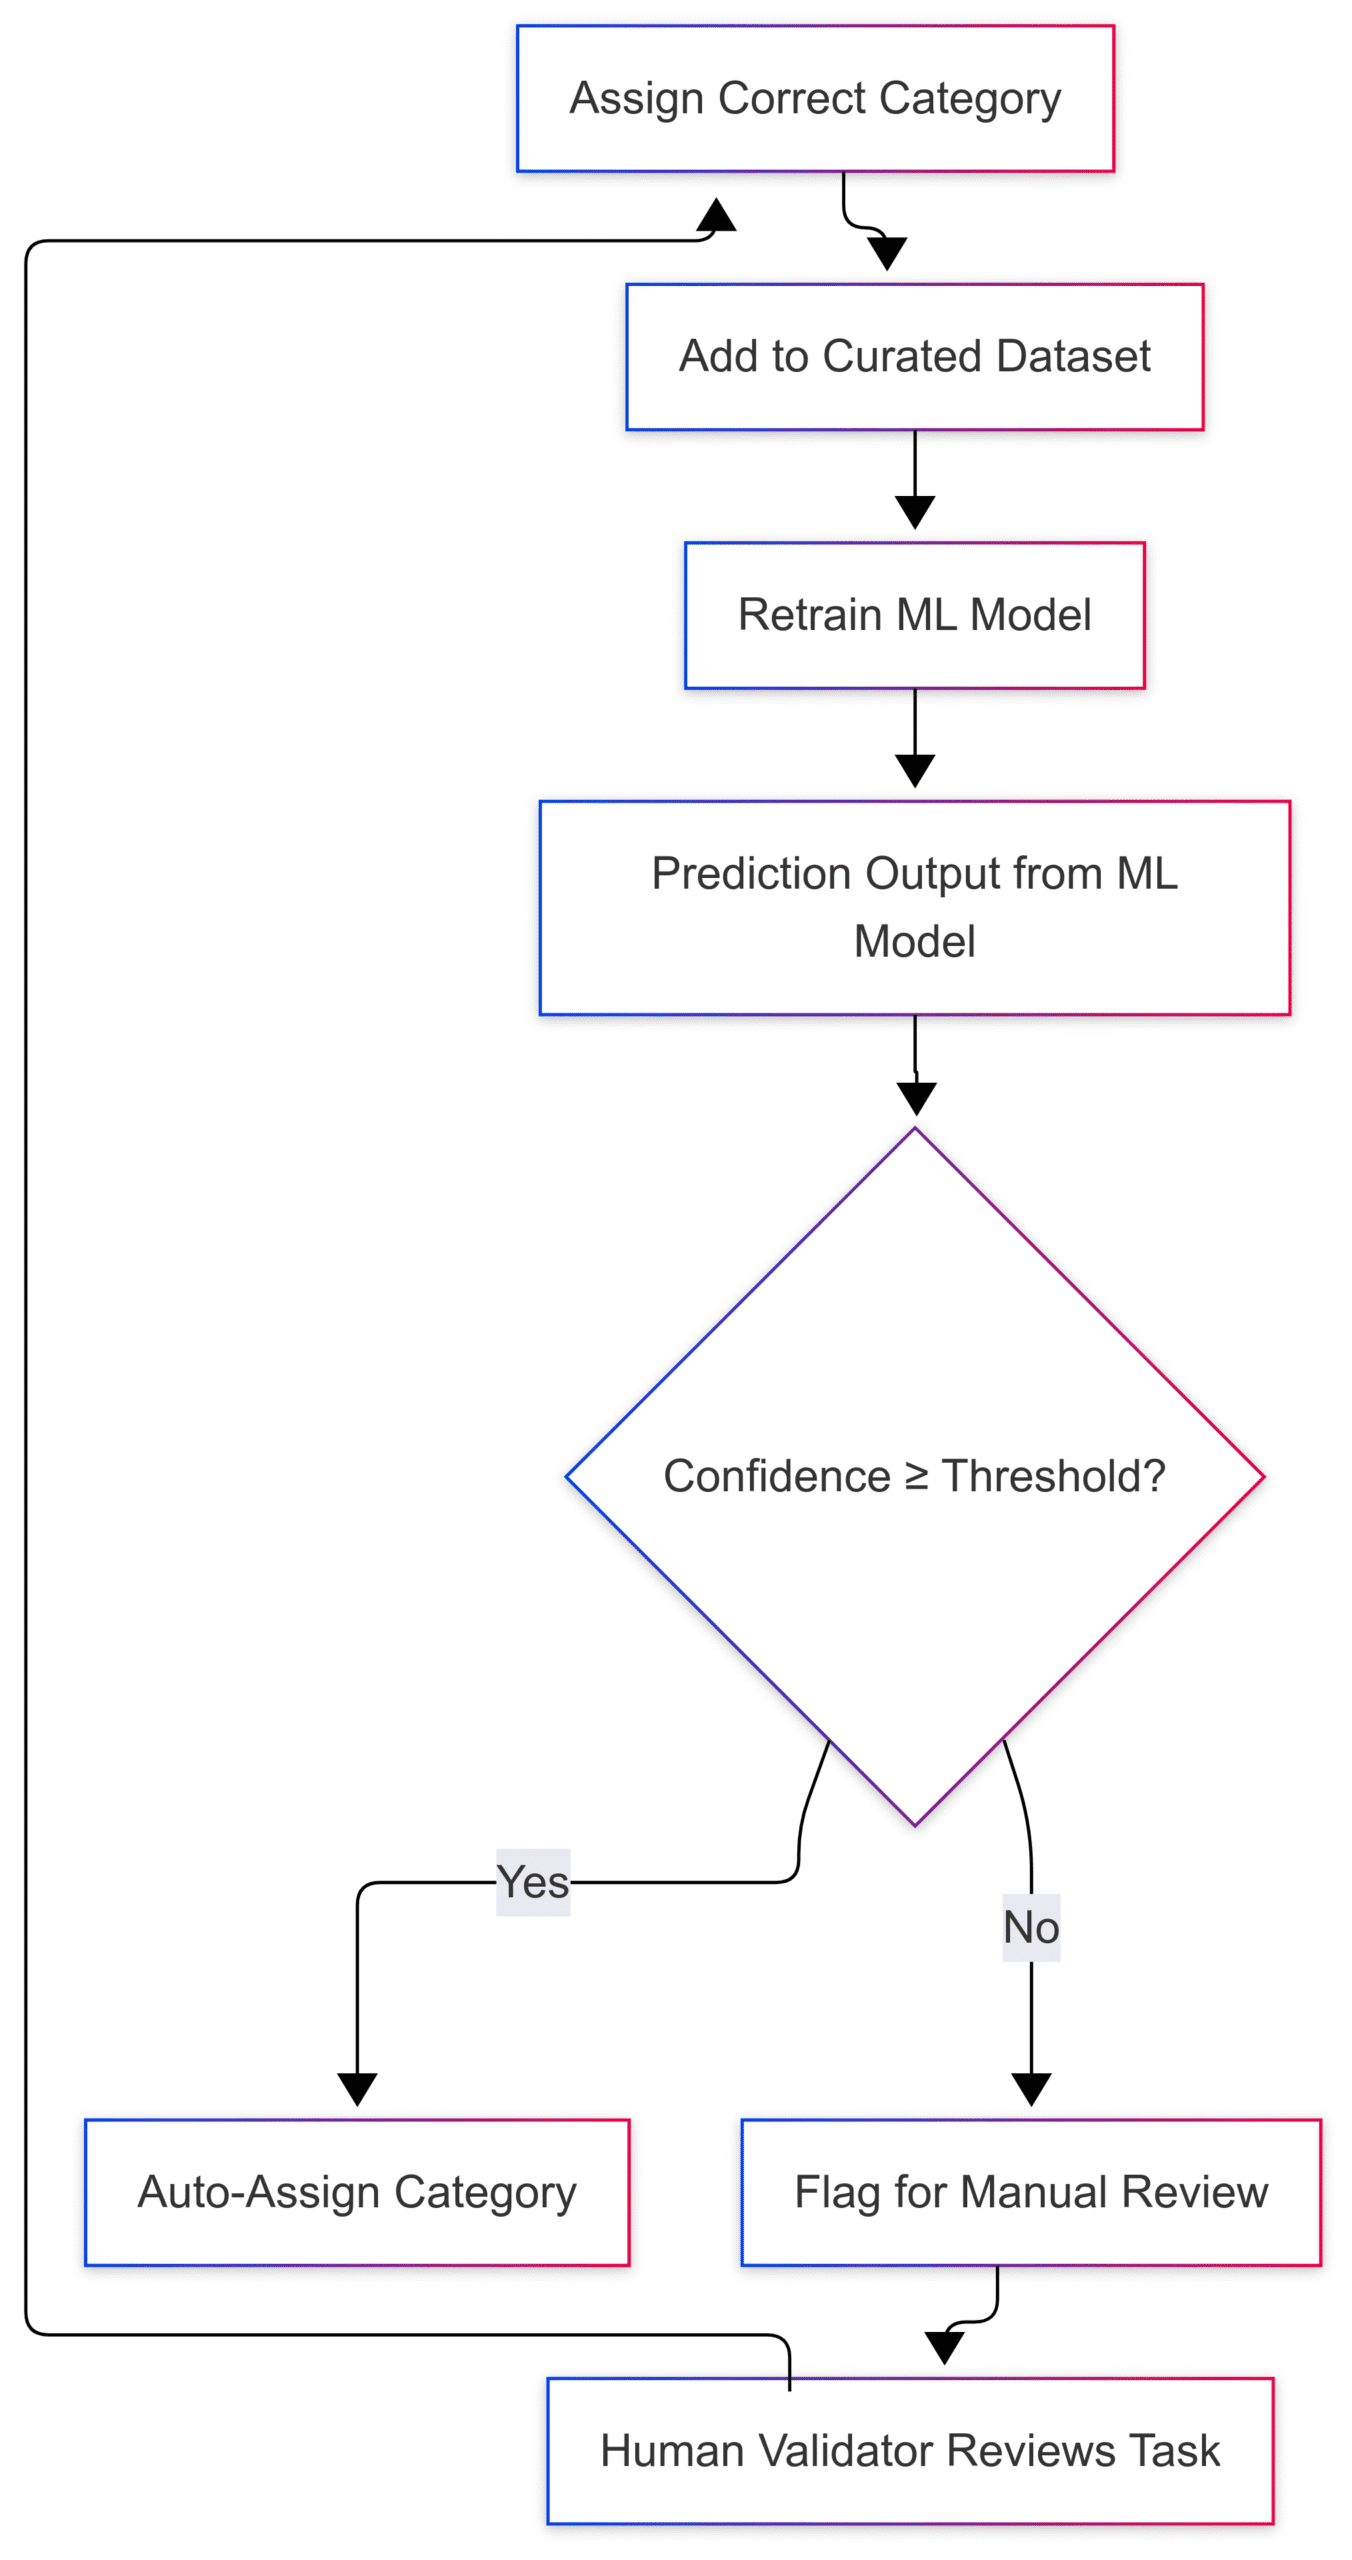
Figure: Human-in-the-loop feedback loop
When model confidence is low, tasks are sent for human validation. The feedback helps retrain the model, making the system smarter over time.
System design highlights
Here’s how it works behind the scenes:
- Data pipeline: We pull timesheet logs daily via Cron jobs from Zoho Projects.
- On-demand refreshes: Users can manually trigger data syncs if needed.
- Authentication: Access is locked behind Zoho OpenID SSO to ensure secure, role-based access.
- Data engineering: We cleaned and mapped real-world task data using our internal categories + their definitions + task descriptions, building a training dataset that actually reflects how our teams work.
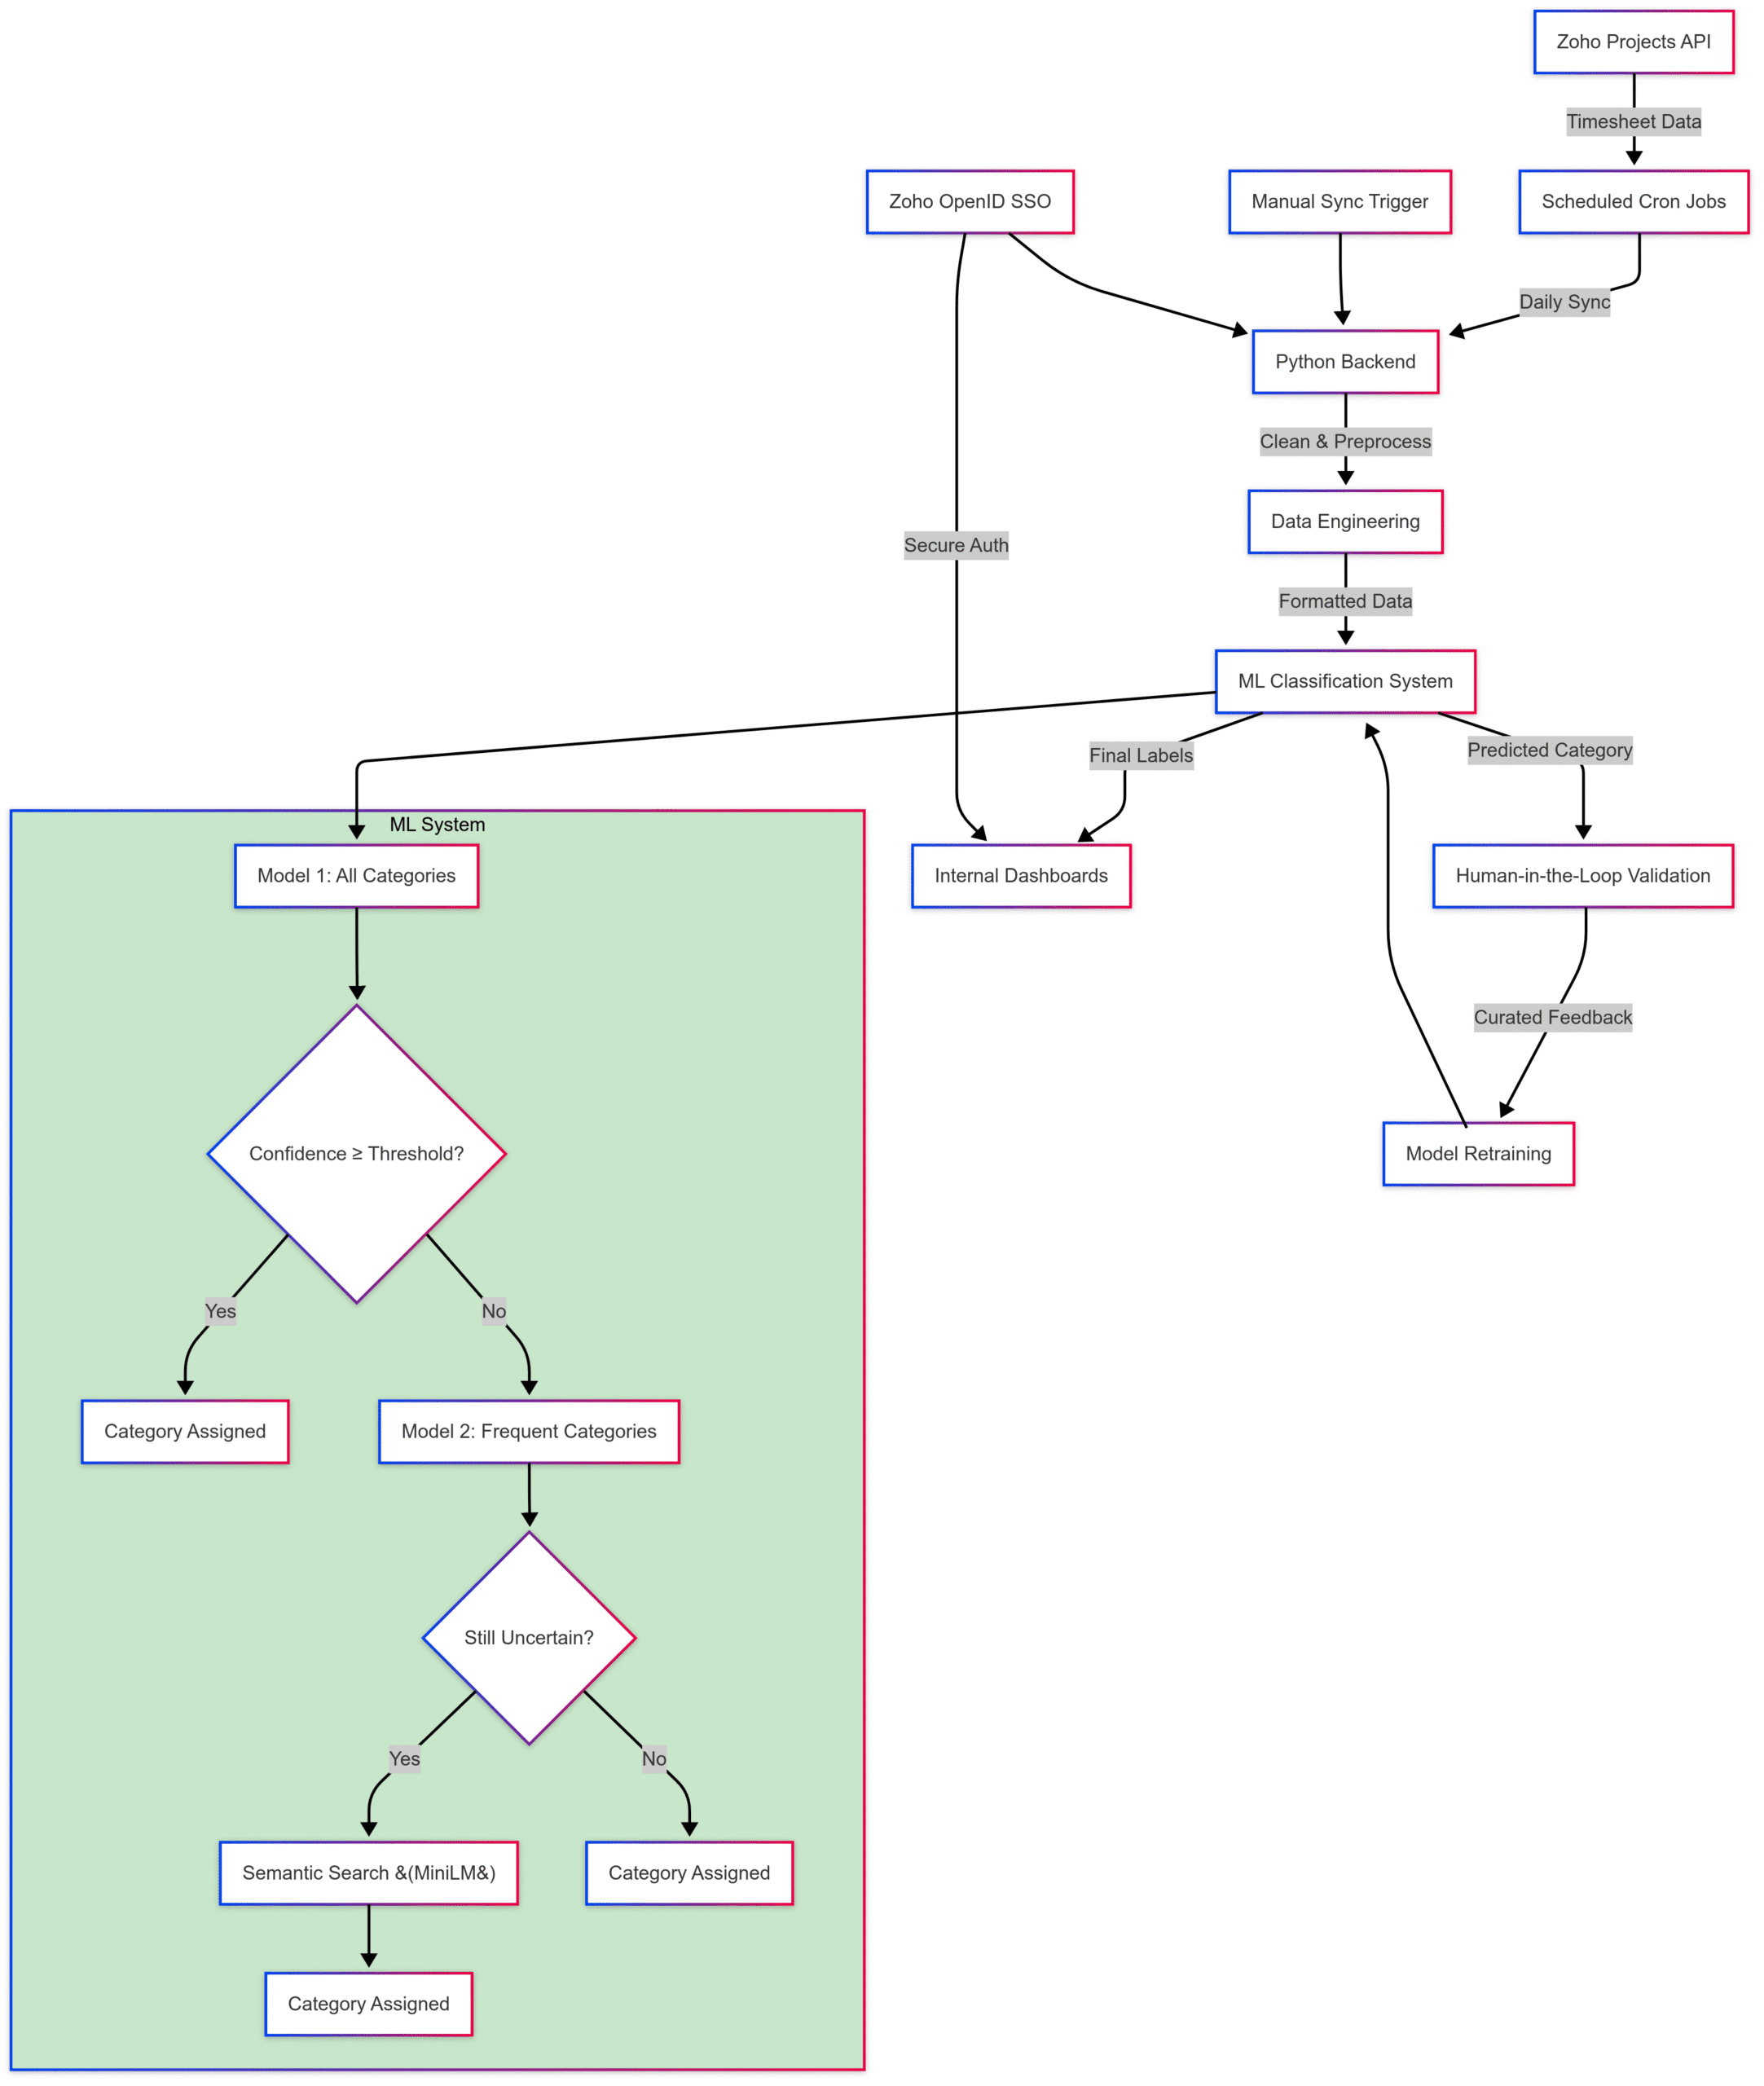
Here’s a high-level system view showing how raw timesheet data flows through our ML pipeline, fallback models, validation, and dashboards.
**Figure: System architecture – ML task classification with feedback loop**
From timesheet syncs and data preprocessing to multi-stage model fallback, semantic search, and human validation — every step is designed to convert noisy input into meaningful insights.
Tech stack behind the scenes
Integrations
- Zoho Projects API – fetch timesheet logs
- Zoho OpenID (SSO) – secure authentication
Machine learning & NLP
- LightGBM – multi-stage classification
- Hugging face all-MiniLM-L6-v2 – semantic search
- Custom embeddings – task titles + descriptions + curated labels
Data engineering & backend
- Python – orchestration and model logic
- Pandas / NumPy – transformation and structuring
- Feature engineering – combining title, description, and metadata
Data pipeline
- Cron jobs (Daily) – auto-refresh
- On-demand triggers – user-initiated sync
Reports & output
- Internal dashboards – curated views
- Categorized timesheet data – stored for long-term analysis
Why it matters
This system wasn’t just built for automation — it was built for impact.
- Project Reports let PMs measure time vs. estimates, flag effort creep, and track ROI.
- Weekly Reports provide real-time views into individual and team productivity.
- Strategic visibility into non-billable hours supports better resource planning.
- No more Excel gymnastics every Monday. Just clarity.
What’s next?
We’re already looking ahead:
- Retraining the model with validated task labels
- Handling data drift due to team evolution or GenAI-written tasks
- Adding dashboards to track task classification performance and project health
Upcoming enhancements:
- Project health summaries
- Automated insights on what’s working vs. what needs fixing
- Dynamic dashboards for deep dives
Final thoughts
We didn’t build this system to be flashy. We built it to save time, reduce noise, and deliver clarity — right when the team needs it.
It’s still evolving, and that’s the point.
Because when your data works for you — and not the other way around — your team can focus on what really matters: delivering results.
Backup: Mermaid diagram code:
Diagram 1: Multi-Stage Task Classification Flow
---
config:
 look: neo
 theme: mc
 layout: fixed
---
flowchart TD
 A["Start: New Task Entry"] --> B["Generate Embedding - Task Title + Description"]
 B --> C["Model 1 - Full Classifier"]
 C --> D{"Confidence ≥ 85%?"}
 D -- Yes --> E["Assign Category - Model 1"]
 D -- No --> F["Model 2 - High-Frequency Only"]
 F --> G{"Confidence ≥ 85%?"}
 G -- Yes --> H["Assign Category - Model 2"]
 G -- No --> I["Semantic Search"]
 I --> J{"Match ≥ 30%?"}
 J -- Yes --> K["Assign Category - Semantic Similarity"]
 J -- No --> L["Flag for Manual Review"]
 E --> M["Update Category + Status"]
 H --> M
 K --> M
 L --> M
 M --> N["Log Results"]
 N --> O["Add to Training Data"]
 O --> P["End"]
Diagram 2: Full ML system architecture
---
config:
 look: neo
 theme: neo
 layout: fixed
---
flowchart TD
 subgraph subGraph0["ML System"]
 ConfidenceCheck{"Confidence ≥ Threshold?"}
 Model1["Model 1: All Categories"]
 Final1["Category Assigned"]
 Model2["Model 2: Frequent Categories"]
 FallbackCheck{"Still Uncertain?"}
 SemanticSearch["Semantic Search &fl°°40¶ßMiniLM&fl°°41¶ß"]
 Final2["Category Assigned"]
 Final3["Category Assigned"]
 end
 Zoho["Zoho Projects API"] -- Timesheet Data --> Cron["Scheduled Cron Jobs"]
 Cron -- Daily Sync --> Backend["Python Backend"]
 ManualTrigger["Manual Sync Trigger"] --> Backend
 Backend -- Clean & Preprocess --> Preprocessing["Data Engineering"]
 Preprocessing -- Formatted Data --> Model["ML Classification System"]
 Model -- Predicted Category --> HumanLoop["Human-in-the-Loop Validation"]
 HumanLoop -- Curated Feedback --> Retrain["Model Retraining"]
 Retrain --> Model
 Model -- Final Labels --> Reports["Internal Dashboards"]
 ZohoSSO["Zoho OpenID SSO"] -- Secure Auth --> Reports
 ZohoSSO --> Backend
 Model1 --> ConfidenceCheck
 ConfidenceCheck -- Yes --> Final1
 ConfidenceCheck -- No --> Model2
 Model2 --> FallbackCheck
 FallbackCheck -- Yes --> SemanticSearch
 SemanticSearch --> Final2
 FallbackCheck -- No --> Final3
 Model --> Model1
 style subGraph0 fill:#C8E6C9
Diagram 3: Human-in-the-loop: Closing the feedback loop for smarter automation
---
config:
 look: neo
 theme: mc
 layout: fixed
---
flowchart TD
 A["Prediction Output from ML Model"] --> B{"Confidence ≥ Threshold?"}
 B -- Yes --> C["Auto-Assign Category"]
 B -- No --> D["Flag for Manual Review"]
 D --> E["Human Validator Reviews Task"]
 E --> F["Assign Correct Category"]
 F --> G["Add to Curated Dataset"]
 G --> H["Retrain ML Model"]
 H --> A

