




Introduction
Enterprise Drupal applications are rarely just a bunch of content pages. Usually, they include custom modules, third party integrations, APIs, complex Views, database queries, a few environments, caching layers, Composer dependencies, and infrastructure like AWS. So when something goes wrong, the visible error is often only the last thing you notice, not the root one.
That’s why Drupal Debugging Techniques should go further than simply clearing the cache and checking if the page loads again. Sometimes, a slow page comes from a database query, but sometimes it’s an external API, cache metadata, or an inefficient custom service. A missing field might be more of a configuration hiccup than a Twig issue. And an error that shows up in production may never reproduce locally because the setups are not identical, different databases, different permissions, different config exports, all that.
In this article, we will go through 15 Drupal debugging techniques we use to isolate what’s happening, understand the real cause, fix it safely, and confirm that the change does not spark another issue right after.
Why is Drupal debugging more complex in enterprise projects?
The bigger the Drupal application, the more possible failure points you have.
A request can travel through routing, controllers, services, entities, database queries, Views, render arrays, Twig templates, cache layers, external APIs, and infrastructure before the user sees the final response.
A useful way to think about it is:
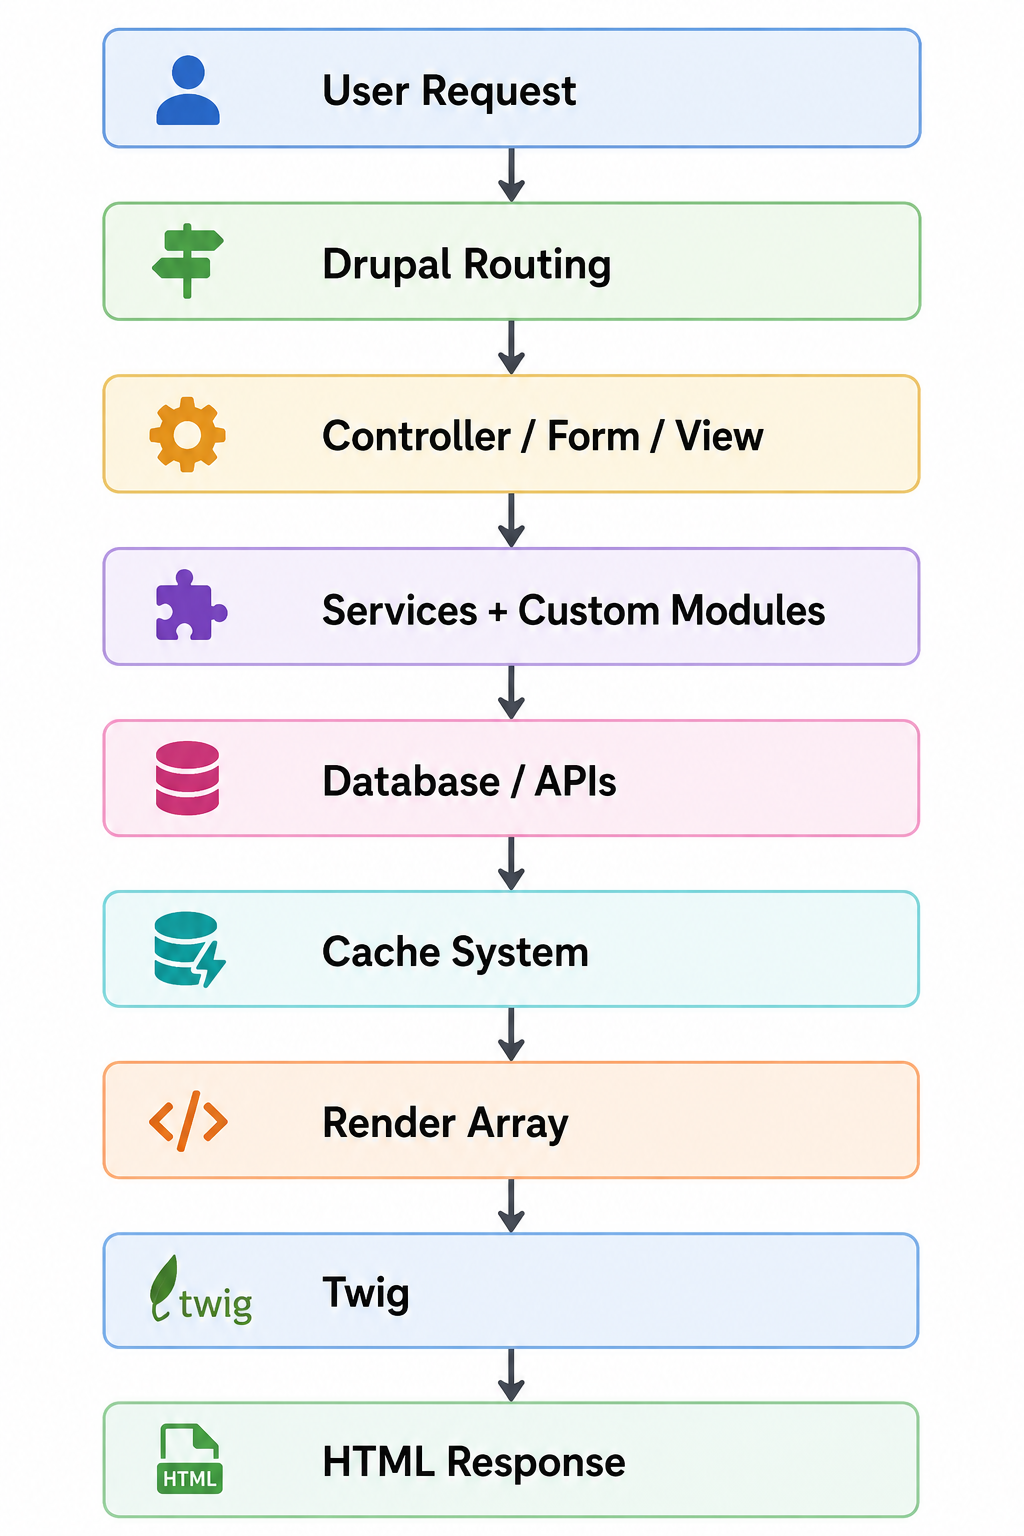
A problem anywhere in that chain can look like a completely different problem at the browser level.That is why good Drupal troubleshooting starts with isolation, not assumptions.
How we approach Drupal debugging in enterprise projects
Our basic debugging process is:
Reproduce → Capture → Isolate → Inspect → Trace → Fix → Verify → Monitor
The important part is the order.
We do not randomly clear caches, modify Twig templates, disable modules, or change production configuration hoping something works.
First, we understand the problem.
Then we choose the debugging tool that can give us evidence.
For example:
-
Twig problem → Twig debugging and template inspection.
-
PHP logic problem → Xdebug.
-
Service problem → dependency injection and service inspection.
-
Cache problem → cache tags, contexts and render metadata.
-
Performance problem → profiling and query analysis.
-
Configuration problem → configuration comparison
-
API problem → request, response and integration logs
This approach saves time because every debugging step has a reason behind it.
15 Drupal debugging techniques we use
Start with Drupal logs and error messages
One of the first things we check is the Drupal log.
Go to Reports → Recent log messages or use Drush:
cmd : drush watchdog:show
Depending on the environment, we also check PHP-FPM, web server, container, and infrastructure logs.
The important thing is not to stop at the last error. Look for the first meaningful error in the chain.
For example:
TypeError → Custom service failed → API response was NULL → Code expected an arrayThe TypeError is the symptom. The unexpected API response may be the actual cause.
Stack traces are particularly useful because they show how execution reached the failing code. Implementation mistake we commonly see: developers fix the line where the exception occurs without checking why the invalid value reached that line.
Use Drush for faster drupal troubleshooting
Drush gives us a quick way to inspect Drupal without relying entirely on the admin UI.
Some useful commands include:
commands :
drush status
drush cr
drush watchdog:show
drush config:status
drush config:get system.site
drush pm:list
drush php:eval "print_r(\Drupal::service('extension.list.module')->getList());
For example, if something works on one environment but not another:
drush status
drush config:status
drush pm:list
can quickly reveal differences in Drupal version, modules, configuration, or environment.The key is to use drush cr when cache really is the problem, not as a universal debugging button.
Enable Drupal development mode safely
Drupal development settings can expose useful debugging information, but they should never be enabled carelessly.
-
Local
Use detailed errors, Twig debugging, and development tools freely.
-
Development
Enable useful debugging while keeping the environment reasonably close to production.
-
Staging
Use production-like configuration while keeping enough logging and diagnostics to reproduce issues.
-
Production
Keep error output away from end users. Log errors internally and monitor them through the appropriate infrastructure.
A common mistake is copying local development settings directly into production. That can expose stack traces, file paths, database information, or other implementation details.
Debug PHP code with Xdebug
When the problem is buried inside PHP logic, Drupal Xdebug debugging is one of the most effective approaches.
Instead of adding dozens of temporary print_r() or var_dump() statements, we can place a breakpoint directly inside the code.
With Xdebug, we can inspect:
- Variables
- Object properties
- Call stacks
- Function arguments
- Execution flow
- Conditional branches
For example:
public function getNewsData($id) {
  $news = $this->newsStorage->load($id);
  return $news->get('field_category')->value;
}
A breakpoint lets us check whether $news exists, whether the field exists, and what value is actually being returned. Step debugging is especially useful when the bug involves several services calling each other.
Use the devel module for deeper inspection
The Devel module is useful during local development when we need to understand Drupal’s internal data structures.
For example:
kint($node);
can provide much more useful information than a simple print_r().
It can help inspect:
- Entities
- Variables
- Render arrays
- Configuration
- Objects
- Field values
This becomes particularly useful when working with complex entity structures.
Implementation mistake: assuming a field value exists directly on an entity without checking the actual field structure and cardinality.
Inspect first. Code second.
Debug Twig templates and theme issues
6. Debug Twig Templates and Theme Issues
Drupal Twig debugging techniques become essential when the problem is visual or template-related.
Enable Twig debugging in the development environment, and Drupal can show template suggestions such as:
node.html.twig
node--article.html.twig
node--article--full.html.twig
You can also inspect variables:
{{ dump(node) }}
or
{{ dump(content) }}
This helps answer questions such as:
- Which Twig template is being used?
- Is the expected variable available?
- Is the field empty?
- Is another template overriding this one?
- Is the render array structured differently than expected?
Diagnose Drupal cache problems
Drupal caching is powerful, but it can also make debugging confusing.
Three concepts matter most:
- Cache tags identify what cached data depends on.
- Cache contexts determine which variations should be cached.
- Cache invalidation removes cached data when its dependencies change.
For example:
Node Updated → Cache Tag Invalidated → Related Cached Output Removed → New Rendered Output Generated
If content changes but the old version continues appearing, investigate cache metadata instead of repeatedly running:
drush cr
Clearing the entire cache may temporarily hide the problem.
It does not explain why the stale data existed. Implementation mistake: treating drush cr as the fix instead of investigating cache tags, contexts, or invalidation logic.
Debug services and dependency injection
Drupal’s service container is central to modern Drupal development.
If a custom service fails, check:
- Service name
- Service definition
- Constructor arguments
- Injected dependencies
- Service availability
- Container rebuild requirements
For example:
services:
  my_module.news_manager:
    class: Drupal\my_module\Service\NewsManager
    arguments:
      - '@entity_type.manager'
      - '@http_client'
If the constructor expects two dependencies but the service definition provides one, Drupal will fail before your actual business logic runs. When debugging service problems, inspect the dependency chain before changing the implementation.
Identify database query bottlenecks
Not every slow Drupal page is a PHP problem.
Sometimes, the database is doing too much work.
Look for:
- Slow queries
- Excessive queries
- Large joins
- Missing indexes
- Database contention
- Repeated queries inside loops
A simple problem can look like this:
foreach ($items as $item) {
  $entity = $storage->load($item->id());
}
If this results in hundreds of individual operations, the problem may not be the loop itself. The data-loading strategy may need to change. For Drupal performance debugging, measure database execution time before optimizing code.
For Drupal performance debugging, measure database execution time before optimizing code.
Debug views and rendering problems
Views can become complicated when filters, relationships, contextual filters, exposed filters, and caching are combined.
When a View returns unexpected results, check.
- Filters
- Relationships
- Contextual filters
- Query conditions
- Access conditions
- Result rendering
- View caching
A useful technique is to inspect the generated query during development.
For example:
Expected: 12 results
Actual:   3 results
Check:
Filter → Relationship → Join → Access → Cache
A View that returns incorrect data is not necessarily a database problem. The query may be correct while the filter or relationship configuration is wrong.
Troubleshoot Drupal configuration issues
Configuration problems are particularly common when multiple environments are involved.
For example:
Local → Development → Staging → Production
If configuration is changed manually on one environment, configuration drift can appear.
Useful commands include:
drush config:status
drush config:export
drush config:import
Check for:
- Missing configuration
- Different module settings
- Different View configuration
- Different field definitions
- Environment-specific settings
- Configuration that was never imported
When debugging an environment-specific issue, always ask:
Is the code different, or is the configuration different? That question can save hours.
That question can save hours.
Debug composer and module dependency problems
Composer problems often appear after a module update, Drupal core update, or deployment.
Start by checking:
composer show
composer why-not drupal/core
composer validate
Then inspect:
- Package versions
- Drupal core compatibility
- PHP version
- Required extensions
- Module dependencies
- Locked versions in composer.lock
For example, a module may support Drupal 11 but require a PHP version that the server does not have. The visible error may mention Composer, while the real compatibility issue is PHP or another dependency. For upgrade-related troubleshooting, our Drupal 10 to 11 upgrade troubleshooting guide goes deeper into the checks that should happen before updating production.
Debug APIs and third-party Integrations
This is where enterprise Drupal applications become especially interesting.
A Drupal page may depend on several external systems:
When an integration fails, inspect the entire request lifecycle.
When an integration fails, inspect the entire request lifecycle.
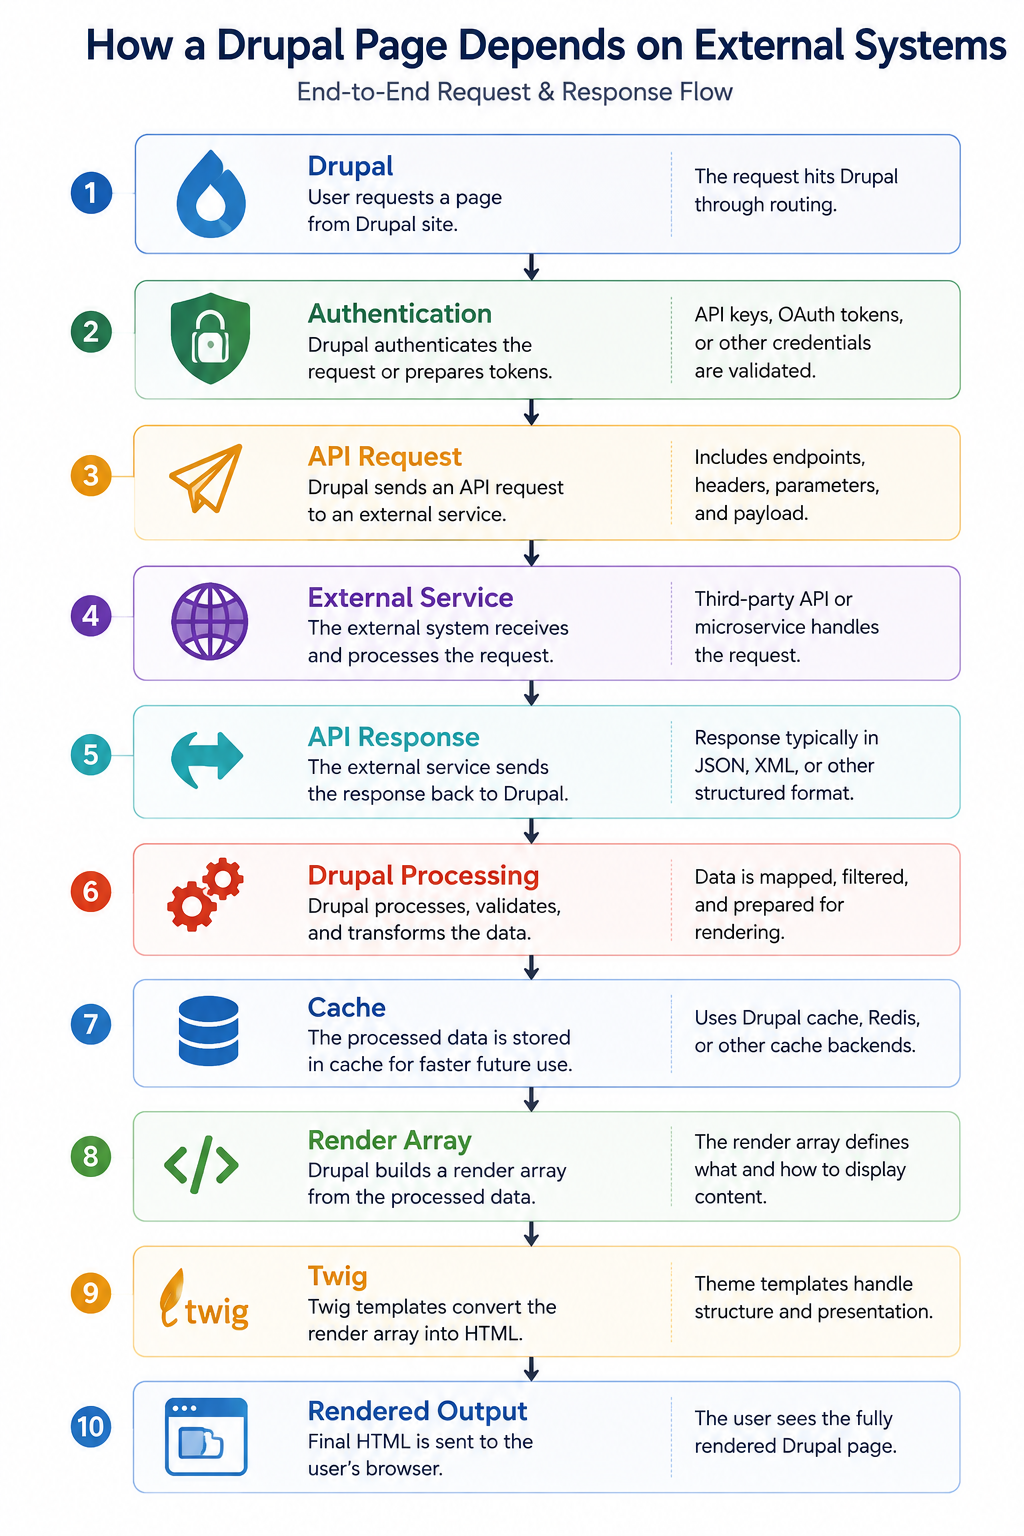
When an integration fails, inspect the entire request lifecycle.
Check:
- Request URL
- HTTP method
- Authentication
- Headers
- Payload
- Response status
- Response body
- Timeout
- External service logs
For example, an API returning 200 does not automatically mean the integration worked. The response structure may have changed. Implementation mistake: logging only the final Drupal error instead of logging enough information to understand the API interaction.
Never log passwords, access tokens, API keys, or other secrets.
Profile drupal performance before optimizing
Performance debugging should start with measurement.
Look at:
| Area | What to investigate |
| Request | Total execution time |
| PHP | Expensive functions |
| Database | Slow or repeated queries |
| Memory | High memory consumption |
| Cache | Hit and miss behavior |
| APIs | External response time |
| Rendering | Expensive render operations |
An illustrative benchmark might look like:
| Test | Before | After |
| Page response | 2.8s | 1.4s |
| Database queries | 420 | 160 |
| Memory | 180 MB | 125 MB |
| API calls | 8 | 3 |
These numbers should be treated as example measurements, not universal Drupal benchmarks. The useful comparison is your application’s actual before-and-after behavior. The rule is simple: measure first, optimize second.
Reproduce production bugs safely
Production is where you investigate the impact. It should rarely be where you experiment.
A safer workflow is:
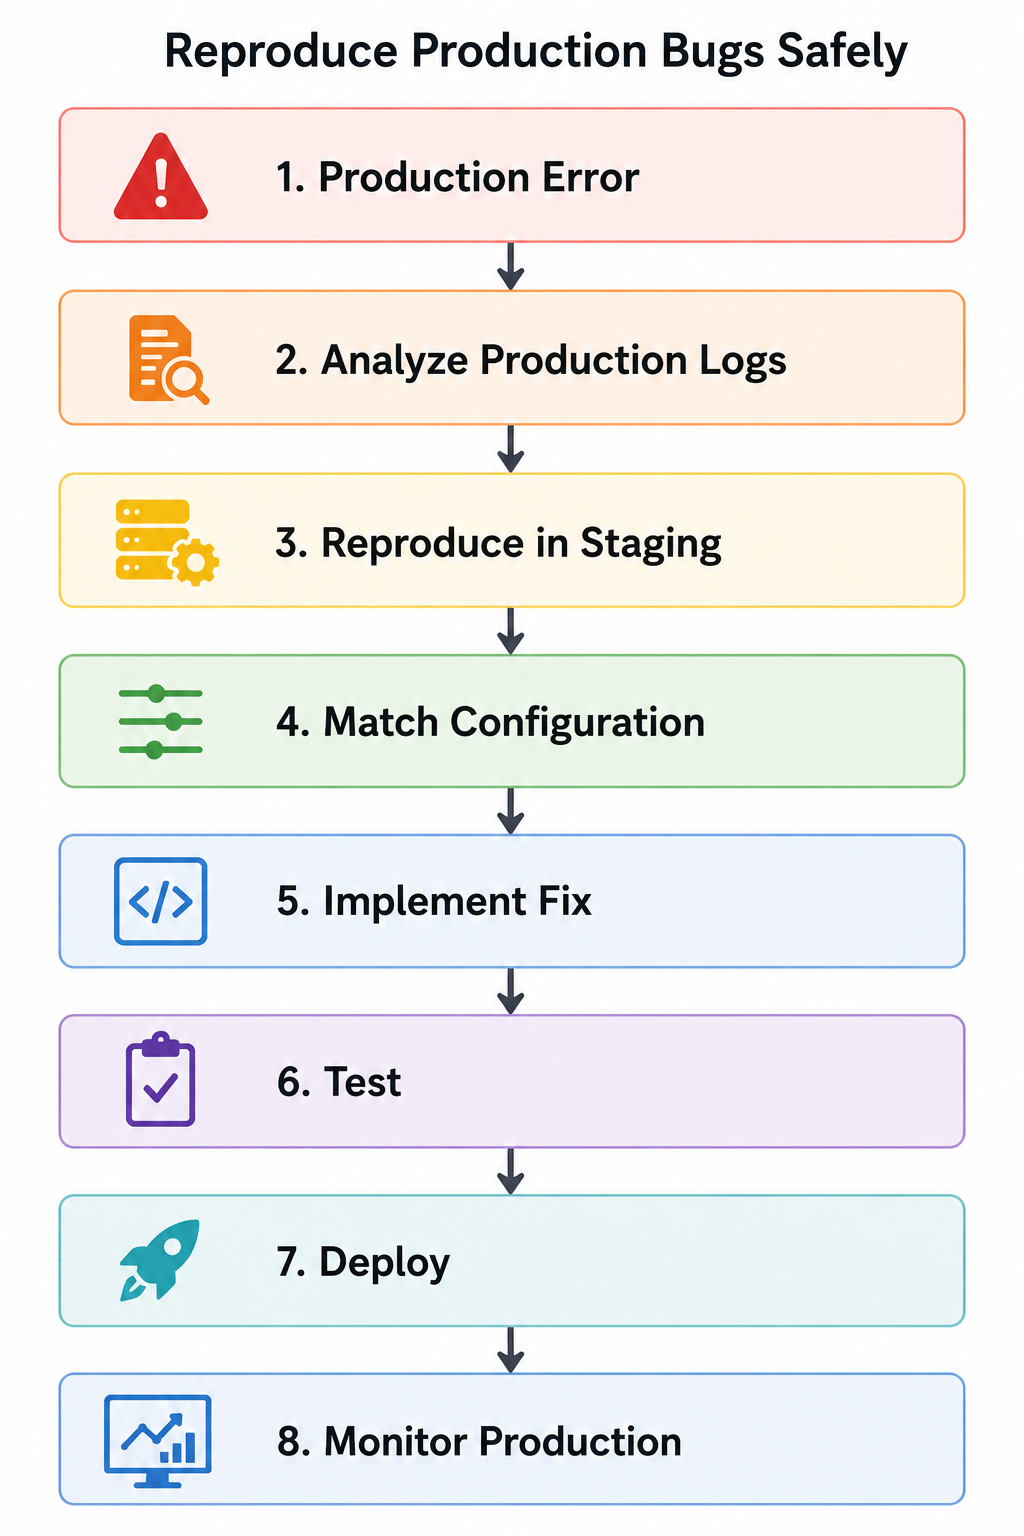
Staging should be close enough to production to reproduce the problem.
That includes relevant configuration, module versions, APIs, permissions, and infrastructure behavior. If the issue cannot be reproduced, compare production logs and configuration rather than making random changes directly on the live site.
Which Drupal debugging tool should you use?
There is no single best debugging tool. The right tool depends on the problem.
| Problem | Recommended tool | What to inspect |
| PHP exception | Drupal logs + Xdebug | Stack trace and execution |
| Twing issue | Twig Debug + Devel | Templates and variables |
| Cache issue | Cache metadata | Tags and contexts |
| Service issue | Xdebug + service inspection | Dependencies |
| Slow page | Profiler + database tools | Execution time |
| View problem | Views UI + query inspection | Filters and joins |
| Configuration issue | Drush | Config differences |
| Composer issue | Composer | Dependencies |
| API failure | Logs + API inspection | Request and response |
| Production issue | Logs + staging reproduction | Environment differences |
The tool should follow the problem, not the other way around.
Common Drupal debugging mistakes to avoid
Clearing every cache immediately
drush cr is useful, but it can hide cache invalidation problems.
Debugging directly in production
Production should be monitored and analyzed, not treated as a development environment.
Changing multiple things at once
If five changes are made and the issue disappears, you may never know which change actually fixed it.
Ignoring configuration
Two environments running the same code can behave differently because their configuration differs.
Trusting the browser error
The browser often shows the final symptom. Drupal, PHP, database, or infrastructure logs may contain the actual cause.
Optimizing without measurements
Making code faster is good. Making code more complicated without proving there was a performance problem is not.
Most frequently asked question in FAQ
Enterprise Drupal debugging best practices
For large Drupal applications, debugging should be treated as an engineering process.
1. Reproduce before fixing:
A bug you cannot reproduce is difficult to validate properly.
2. Keep environments comparable:
Configuration and dependency differences create false leads.
3. Use logs strategically:
Log enough information to diagnose the issue without exposing secrets.
4. Change one thing at a time: This keeps the investigation measurable.
5. Document the root cause:
The fix matters, but understanding why the problem happened prevents it from returning.
6. Test after every fix:
Check the original issue and related functionality.
7. Monitor after deployment:
A successful deployment is not the end of debugging.
8. Measure performance:
Use actual request time, query count, memory, and API timings rather than assumptions.
Conclusion
Effective Drupal debugging is not about knowing one magic command or module. It is about following evidence through the application until you find the actual cause.
The Drupal Debugging Techniques covered here give us a practical way to move from symptoms to causes: reproduce the problem, isolate the failing layer, inspect the data, trace the execution, fix it, test it, and monitor the result.
That approach becomes even more important as Drupal applications grow across multiple environments, custom modules, APIs, databases, caching layers, and infrastructure. At August, this structured approach also shapes how we deliver Drupal development services for complex enterprise websites.
The real goal of debugging is not simply to make an error disappear. It is to understand why it happened and make sure the fix continues to work as the application evolves.

